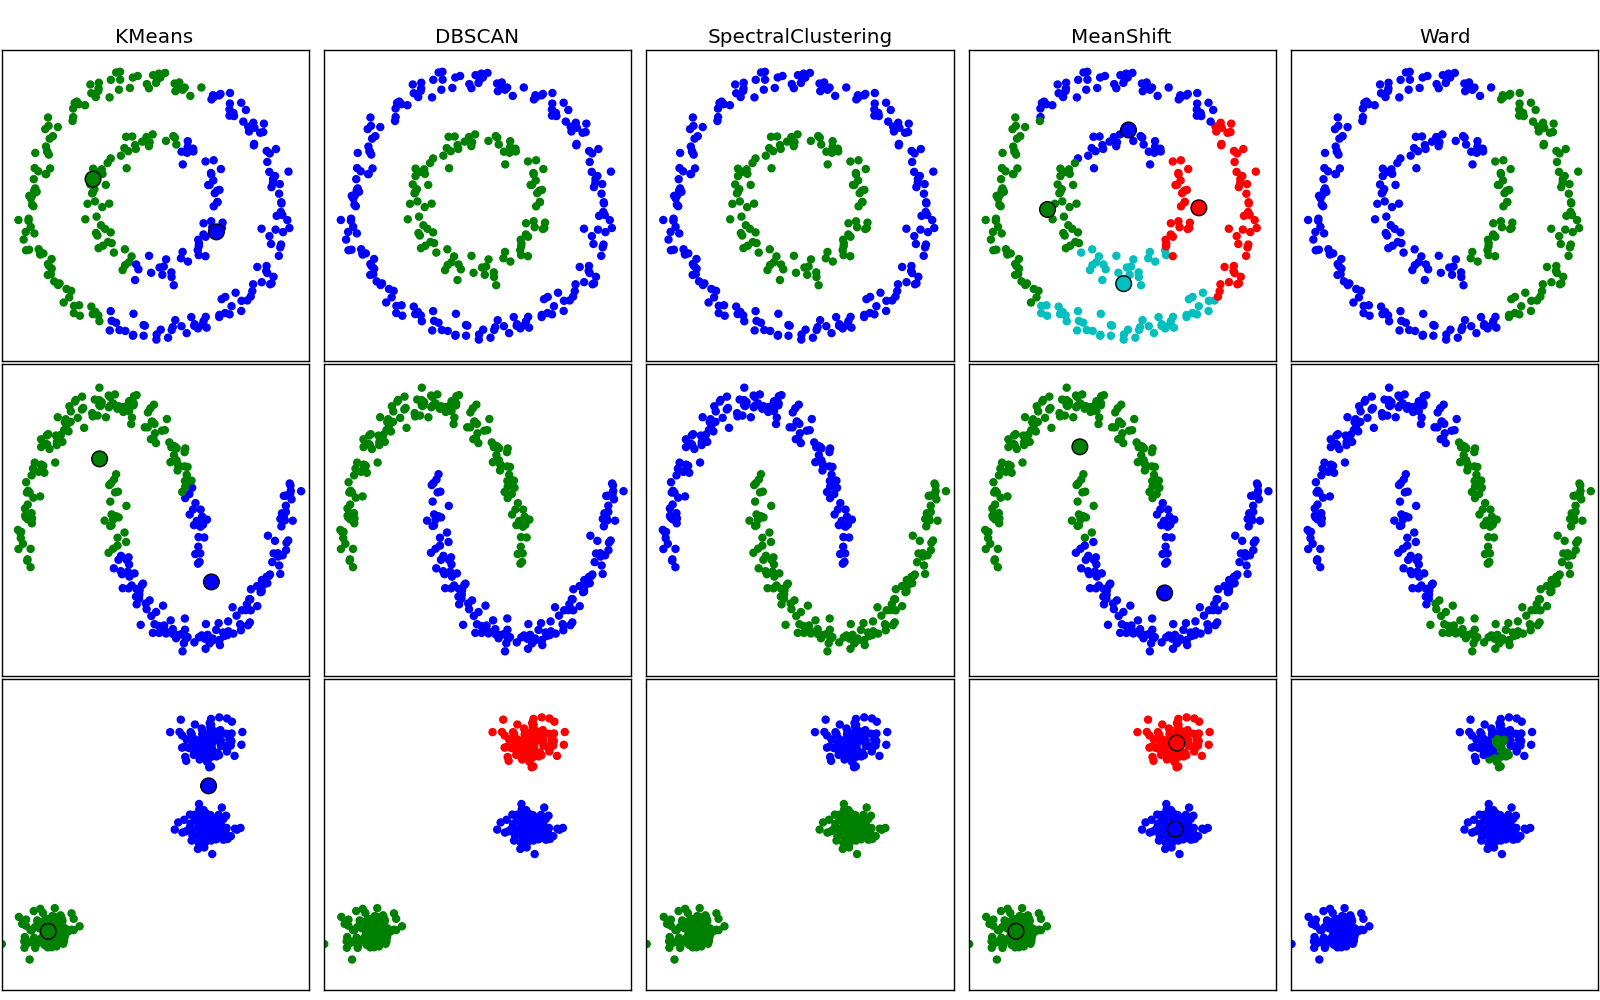
Comparing different clustering algorithms on toy datasets
This example aims at showing characteristics of different clustering algorithms on datasets that are “interesting” but still in 2D.
While these examples give some intuition about the algorithms, this intuition might not apply to very high dimensional data.

Python source code: plot_cluster_comparison.py
print __doc__

import numpy as np
import pylab as pl

from sklearn.cluster import MeanShift, estimate_bandwidth
from sklearn.cluster import KMeans
from sklearn.cluster import Ward
from sklearn.cluster import SpectralClustering
from sklearn.cluster import DBSCAN
from sklearn.neighbors import kneighbors_graph
from sklearn.datasets import make_circles, make_moons, make_blobs
from sklearn.preprocessing import Scaler

# Generate datasets
n_samples = 300
noisy_circles = make_circles(n_samples=n_samples, factor=.5, noise=.05)
noisy_moons = make_moons(n_samples=n_samples, noise=.05)
blobs = make_blobs(n_samples=n_samples, random_state=8)

colors = np.array([x for x in 'bgrcmykbgrcmykbgrcmykbgrcmyk'])
colors = np.hstack([colors] * 5)

pl.figure(figsize=(16, 10))
pl.subplots_adjust(left=.001, right=.999, bottom=.01, top=.95, wspace=.05,
        hspace=.01)

plot_num = 1
for i_dataset, dataset in enumerate([noisy_circles, noisy_moons, blobs]):
    X, y = dataset
    # normalize dataset for easier parameter selection
    X = Scaler().fit_transform(X)

    # estimate bandwidth for mean shift
    bandwidth = estimate_bandwidth(X, quantile=0.3)

    # connectivity matrix for structured Ward
    connectivity = kneighbors_graph(X, n_neighbors=20)
    # make connectivity symmetric
    connectivity = 0.5 * (connectivity + connectivity.T)

    # create clustering estimators
    ms = MeanShift(bandwidth=bandwidth, bin_seeding=True)
    two_means = KMeans(k=2)
    ward_five = Ward(n_clusters=2, connectivity=connectivity)
    spectral = SpectralClustering(k=2, mode='arpack')
    dbscan = DBSCAN(eps=.3)

    for algorithm in [two_means, dbscan, spectral, ms, ward_five]:
        # predict cluster memberships
        if algorithm == spectral:
            algorithm.fit(connectivity)
        else:
            algorithm.fit(X)
        y_pred = algorithm.labels_.astype(np.int)

        # plot
        pl.subplot(3, 5, plot_num)
        if i_dataset == 0:
            pl.title(str(algorithm).split('(')[0])
        pl.scatter(X[:, 0], X[:, 1], color=colors[y_pred].tolist())

        if hasattr(algorithm, 'cluster_centers_'):
            centers = algorithm.cluster_centers_
            center_colors = colors[:len(centers)]
            pl.scatter(centers[:, 0], centers[:, 1], s=100, c=center_colors)
        pl.xlim(-2, 2)
        pl.ylim(-2, 2)
        pl.xticks(())
        pl.yticks(())
        plot_num += 1

pl.show()
