Classifiers Comparison
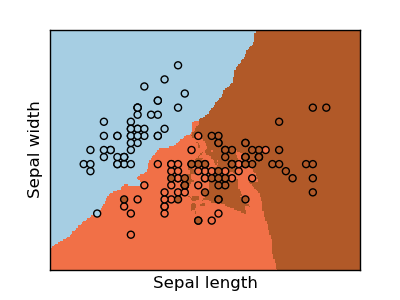
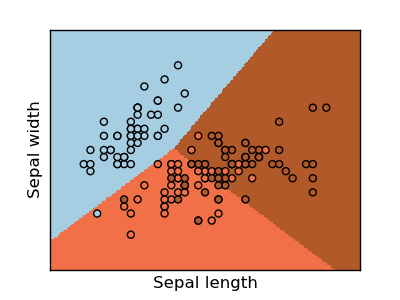
A Comparison of a K-nearest-neighbours, Logistic Regression and a Linear SVC classifying the iris dataset.

Python source code: plot_iris_classifiers.py
print __doc__


# Code source: Gael Varoqueux
# Modified for Documentation merge by Jaques Grobler
# License: BSD

import numpy as np
import pylab as pl
from sklearn import neighbors, datasets, linear_model, svm

# import some data to play with
iris = datasets.load_iris()
X = iris.data[:, :2] # we only take the first two features.
Y = iris.target

h = .02 # step size in the mesh

classifiers = dict(
    knn=neighbors.KNeighborsClassifier(),
    logistic=linear_model.LogisticRegression(C=1e5),
    svm=svm.LinearSVC(C=1e5, loss='l1'),
    )


fignum = 1
# we create an instance of Neighbours Classifier and fit the data.
for name, clf in classifiers.iteritems():
    clf.fit(X, Y)

    # Plot the decision boundary. For that, we will asign a color to each
    # point in the mesh [x_min, m_max]x[y_min, y_max].
    x_min, x_max = X[:,0].min() - .5, X[:,0].max() + .5
    y_min, y_max = X[:,1].min() - .5, X[:,1].max() + .5
    xx, yy = np.meshgrid(np.arange(x_min, x_max, h), np.arange(y_min, y_max, h))
    Z = clf.predict(np.c_[xx.ravel(), yy.ravel()])

    # Put the result into a color plot
    Z = Z.reshape(xx.shape)
    pl.figure(fignum, figsize=(4, 3))
    pl.set_cmap(pl.cm.Paired)
    pl.pcolormesh(xx, yy, Z)

    # Plot also the training points
    pl.scatter(X[:,0], X[:,1], c=Y)
    pl.xlabel('Sepal length')
    pl.ylabel('Sepal width')

    pl.xlim(xx.min(), xx.max())
    pl.ylim(yy.min(), yy.max())
    pl.xticks(())
    pl.yticks(())
    fignum += 1

pl.show()